March 25, 2024
- 10 min read
Historical high demand and the lowest inventory on record produced another frantic year in the Muskoka Waterfront market. Prices continued to climb in 2021, although the pace of change in certain segments
seemed to have slowed slightly compared to the massive yearly increases we saw in 2020. Two years of double-digit growth have fundamentally changed the waterfront market – 30-40% price increases
have resulted in an average price of $1,637,892 for Muskoka Waterfront properties. Sales fell slightly as a result of meagre levels of inventory – demand remained, as it did it 2020, off the charts.
| 2017 | 2018 | 2019 | 2020 | 2021 | |
|---|---|---|---|---|---|
| Average Sale Price | 1,605,593 | 1,458,874 | 1,416,988 | 1,943,289 | 2,630,505 |
| % Difference in Sale Price | -9% | -3% | 37% | 35% | |
| Median Sale Price | 1,205,000 | 1,090,000 | 1,105,250 | 1,529,500 | 1,806,500 |
| % Difference in Median Price | -10% | 1% | 38% | 18% | |
| Unit Sales | 157 | 113 | 112 | 161 | 134 |
| Average Days on Market | 56 | 59 | 65 | 62 | 30 |
| 2017 | 2018 | 2019 | 2020 | 2021 | |
|---|---|---|---|---|---|
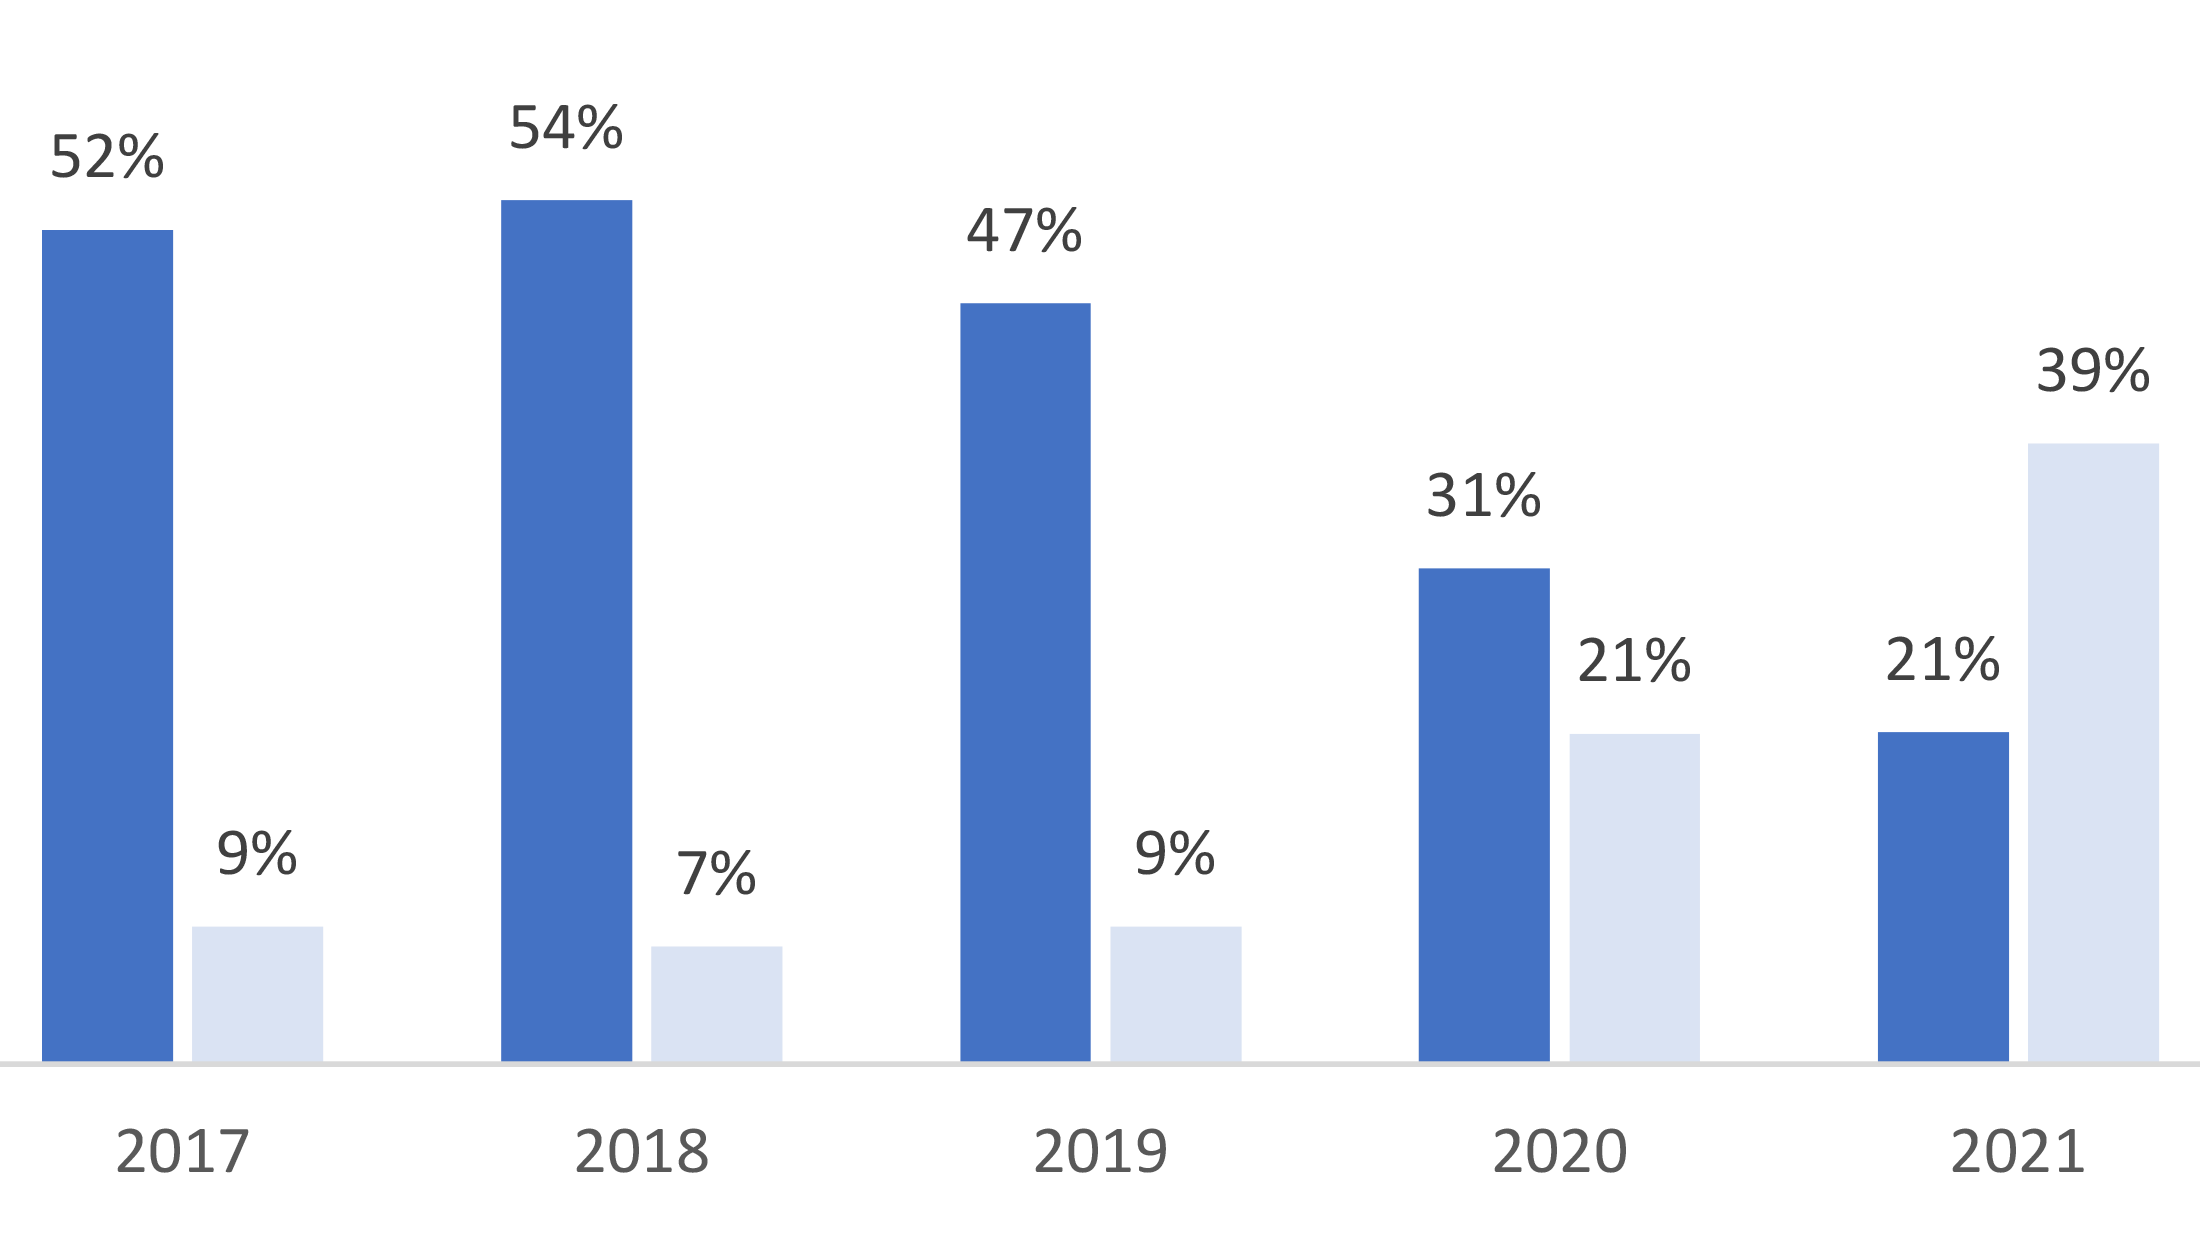
| Average Sale Price | 2,245,566 | 1,922,200 | 2,914,241 | 3,395,697 | 4,115,231 |
| % Difference in Sale Price | -14% | 52% | 17% | 21% | |
| Median Sale Price | 1,582,500 | 1,430,000 | 2,453,280 | 2,600,000 | 2,700,000 |
| % Difference in Median Price | -10% | 72% | 6% | 4% | |
| Unit Sales | 38 | 35 | 40 | 59 | 39 |
| Average Days on Market | 64 | 79 | 72 | 65 | 25 |
| 2017 | 2018 | 2019 | 2020 | 2021 | |
|---|---|---|---|---|---|
| Average Sale Price | 2,697,491 | 2,819,726 | 3,081,735 | 3,610,883 | 3,720,415 |
| % Difference in Sale Price | 5% | 9% | 17% | 21% | |
| Median Sale Price | 1,650,000 | 2,127,500 | 2,217,500 | 3,165,000 | 2,900,000 |
| % Difference in Median Price | 29% | 4% | 43% | -8% | |
| Unit Sales | 53 | 36 | 34 | 59 | 35 |
| Average Days on Market | 52 | 110 | 69 | 54 | 50 |
Unit sales fell sharply, but prices continued to see double-digit year over year increases. Just over half of the properties sold over the list price.
The most active segment was in the 1M-2M price range, with 63% of sales in that price category selling over the list price. Only 20 sales occured for properties in the $750,000 and under range – five years ago this price range accounted for roughly 40% of the total sales on the three big lakes.
Inventory levels dipped below the record low levels of 2020. The weighted average for monthly active listings in 2021 was 37, down from 84 in 2020 and 25% of the average of 145 in 2019.
| 2020 | 2021 | +/-YR/YR | |
|---|---|---|---|
| Units Sold | 279 | 208 | -25% |
| Average | 2,603,074 | 3,092,290 | +19% |
| Median | 1,940,000 | 2,274,500 | +17% |
| Average Days | 61 | 32 | -47% |

The small lake market in South Muskoka was the epicentre of activity in the region. Average and median prices jumped 36% and 33% respectively from 2020. Units sales remained virtually unchanged at 302 sales. The average price broke the one million dollar mark for the time on record. Pre-pandemic entry price points of 400-500k were a distant memory.
Historically, smaller lake properties have offered a relatively affordable option with the majority of properties selling under $500,000. Conversely, sales over a million were relatively rare – in 2021, they accounted for almost 40% of all sales. Over the past two years, the smaller lake market has undergone a dramatic shift as a result of the intense demand brought on by the pandemic driven consumer.
| 2020 | 2021 | +/-YR/YR | |
|---|---|---|---|
| Units Sold | 302 | 301 | — |
| Average | 740,362 | 1,006,226 | +36% |
| Median | 650,000 | 865,000 | +33% |
| Average Days | 35 | 23 | -34% |